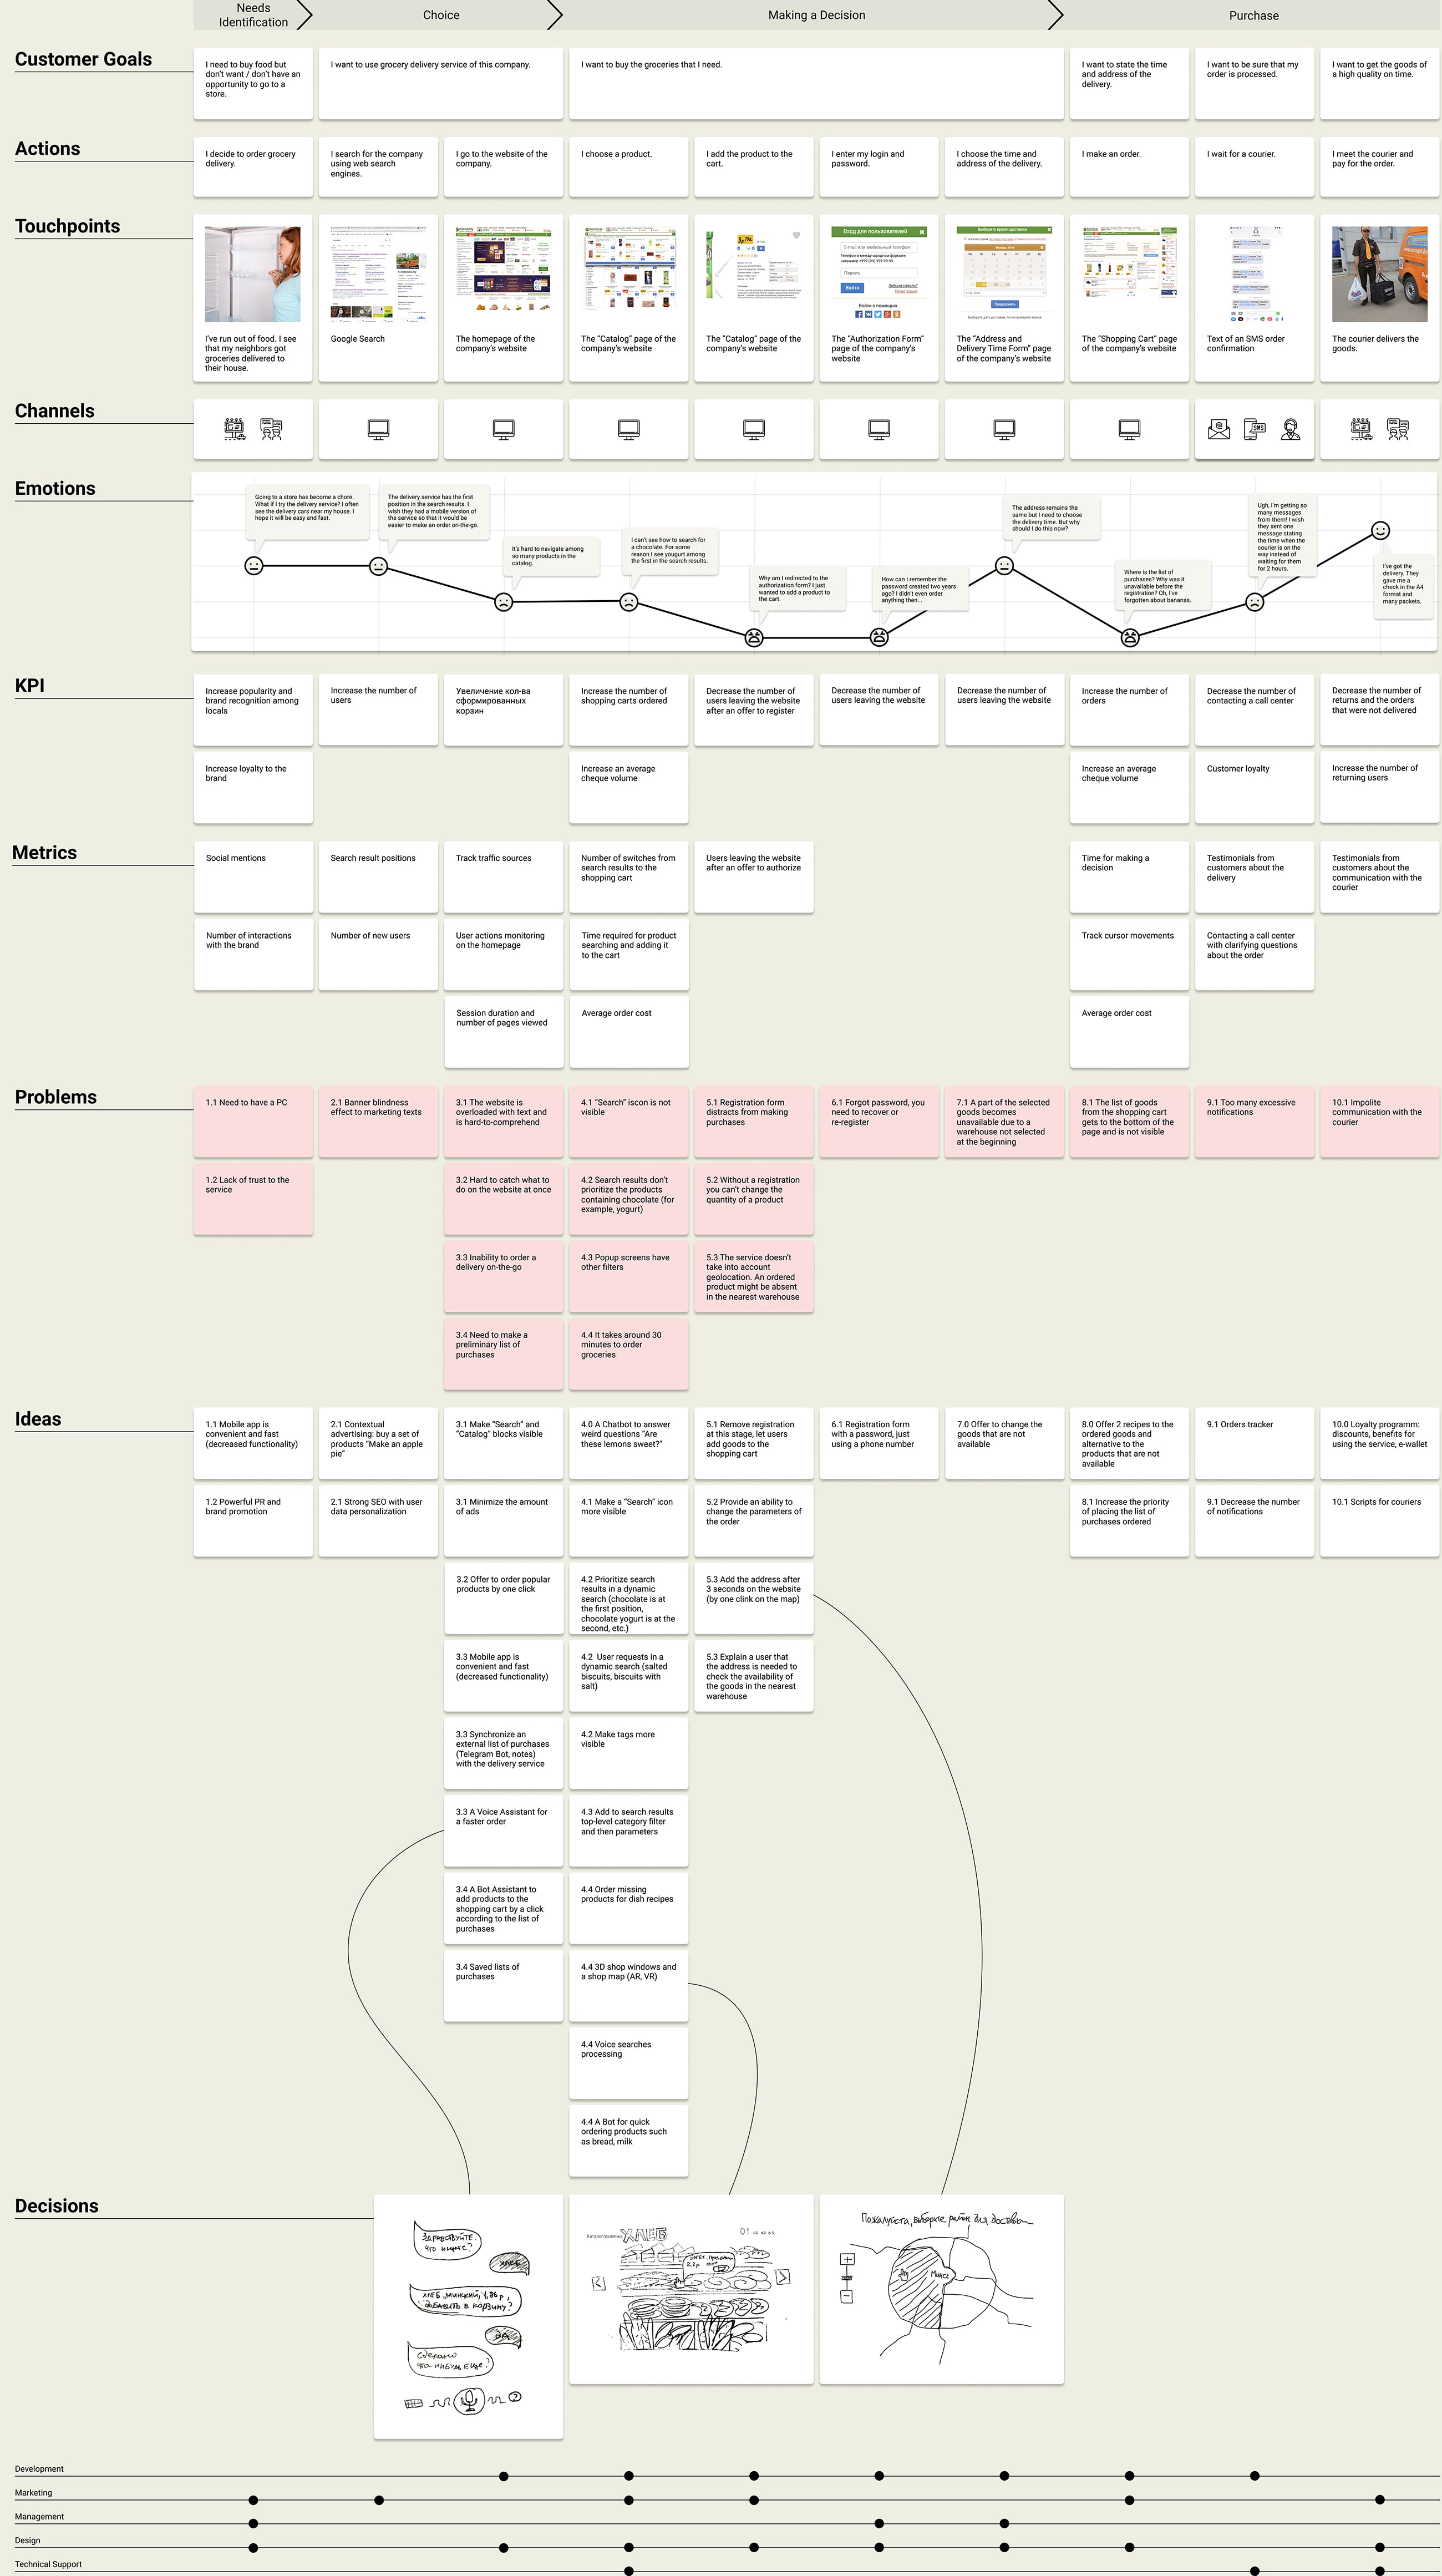
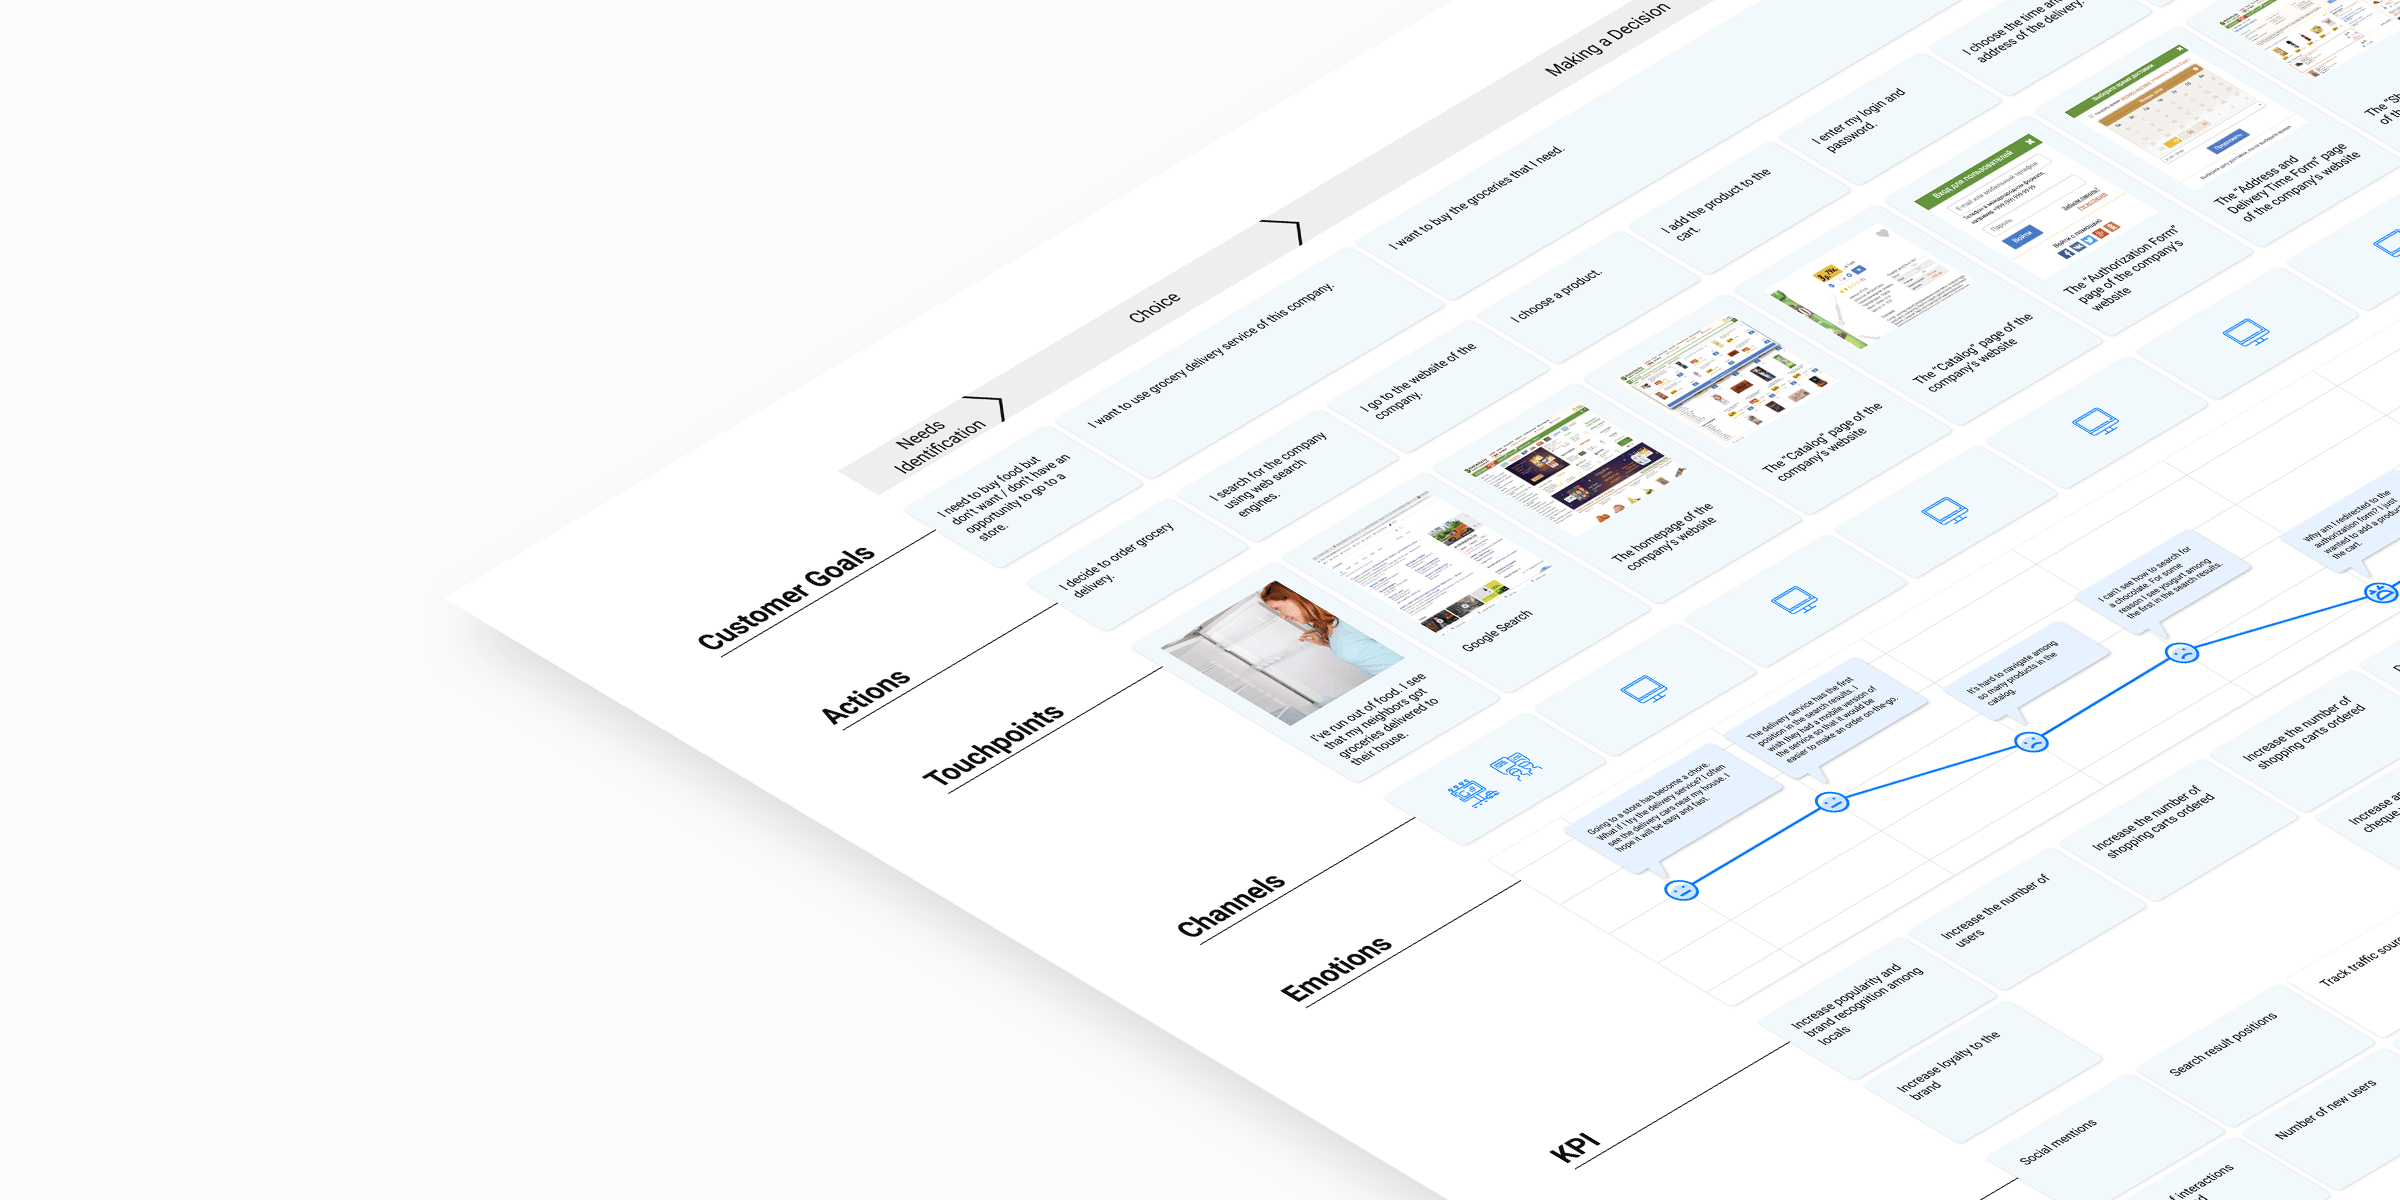
Visualization of user interaction with a grocery delivery service.
Created
2019
Customer
Artezio
Challenge
Identify barriers for users while ordering and receiving goods. Find solutions to these issues.
Identifying
Persona
Before testing it’s important to identify a persona. It is a typical user who makes about 80% of possible actions for this particular user role. It’s a registered user who makes purchases from time to time.
Marina Cheshueva; 31 years old; economist; Minsk, Belarus.
Values: an ability to order goods on-the-go; a variety of goods and products.
Sometimes I order a grocery delivery since it’s very helpful. You don’t need to stay in a queue with a kid when my husband is on a business trip. Certainly, sometimes there are problems with the quality but I already know what’s worth buying and what is not.
Testing
Testing of the Service by Real Users
10 people took part in the testing. They are representatives of a target audience and are familiar with the service but don’t use it on a regular basis. During the testing we conducted:
-quantity research (time, number of goods in the shopping cart);
-quality research (order cancellation, abandoned carts, “not found” results, etc.).
Step 1
We find real users willing to test the application for grocery delivery.
Step 2
We watch the process of how users interact with the app in order to achieve their main goal.
Step 3
We make notes and analyze all the gathered data.
Prototyping
Journey Map Prototype
With the help of stickers, we created CJM Wall. This approach lets each team member be engaged in the process. Users’ concerns and emotions are paid much attention to. We analyzed the data gathered during the testing phase to capture all the reactions expressed by users while interacting with the service. After that, we brainstormed on the question to find solutions to the barriers that the users had. In addition, we came up with several ideas on how to improve the features that the users liked.
Idea Prioritization
The offered solutions are classified according to the Eisenhower Matrix. Thanks to this approach, we identified the solutions that were important for the users and that could be implemented as quickly as possible. The rest of the ideas formed a backlog and recommendations.
Implementation
Journey Map Creation
Journey Map is represented in the form of a table. It not only consists of users’ steps and their emotions but also includes all the possible interactions with the app that can be not obvious at first sight.
Results
The described steps and interactions with the product are based on the interviews and testing of real users. This tool structures required changes and improvements.
The identified issues and solutions to them at each stage of interacting with the product provide ideas not only for the improvement of the app itself but also for the optimization of internal processes within the delivery company (orders processing, delivery service, call centers, application promotion).
Upon the customer’s request, the identified solutions may be represented in the form of a mockup. Based on mockups, they can be prototyped at the next stages of a design process.
The Journey Map is easy-to-comprehend and showcases the cause-and-effect relations of the processes.